Waterway Map - The Milner Team at Florida Future Realty Skip to content
The Milner Team

Explore Southwest Florida.

(239) 895-9383
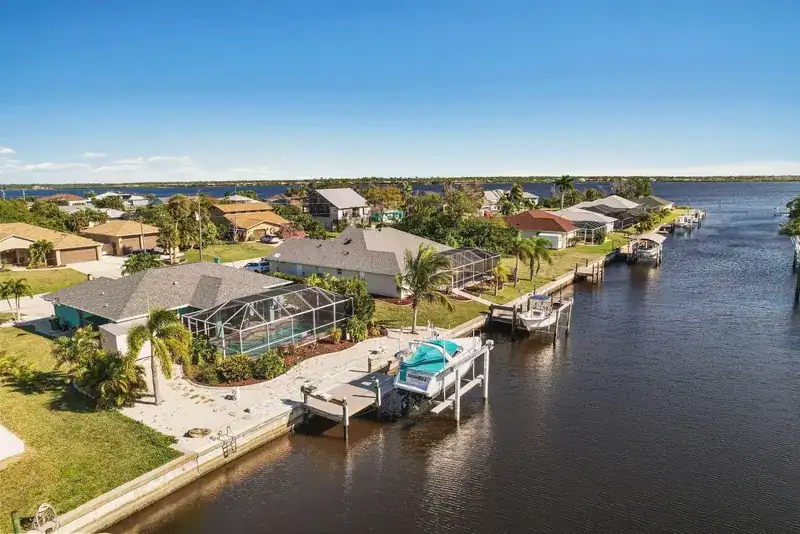
Cape Coral homes and docks along the waterway

Cape Coral waterway map

Route a canal, see the blockers.

Use this Cape Coral canal map to explore mapped canal names, bridge clearances, flood zones and utility service areas for an address.

Run the sample 3910 SE 12th AveA real Cape Coral address. Or type yours on the map.

Legend ▸
Default Cape Coral canal intelligence map, captured from this pageMap preview captured from the interactive map. Tiles © Esri · Sources: Esri, TomTom, Garmin, FAO, NOAA, USGS

Built from City of Cape Coral GIS + OpenStreetMap. A starting point, not gospel. We verify vessel fit, bridge clearance at tide, and route reality per address before any offer. Data notes

Full data notes

Data source: City of Cape Coral Public Works GIS and bridge inventory, plus OpenStreetMap routing geometry. Canal polygons are classified SALT/FRESH by the City; freshwater segments that do not reach the Gulf are excluded from routing. Time-to-exit estimates use a flat 5 mph no-wake speed. The Chiquita Lock was removed in June 2025 (City of Cape Coral); former lock-route canals now route directly to the Caloosahatchee, but fixed bridges still determine whether a specific address is direct or indirect gulf access. The route model does not yet account for bridge openings, narrow-canal speed drops, or post-removal dredging restrictions. Treat the route as a starting point. Informational only. Verify with a licensed surveyor, marine contractor, and local authorities before closing on any canal property.

Piers are not queried: a pier at a marina is not a fuel dock, and unnamed ones would be noise. Boat ramps come from OpenStreetMap Overpass (leisure=slipway) with a 60 m dedupe, merged with the FWC Florida Boat Ramp Inventory, which also checks the names and coordinates; 63 ramp points are live, 45 with a real published name and 18 unnamed OSM slipways kept by the plain tag and labelled as unnamed. Trailer ramps and FWC hand-launch sites (kayak and canoe) are both included and each popup names the type. Where FWC lists a ramp on this map as closed, the popup says so. Fuel docks are the OpenStreetMap waterway=fuel set only, 2 points in this area, both unnamed in the map data; FWC publishes ramps, not fuel docks. Boat rental docks are excluded on purpose. Hours, fuel and access change: call ahead. Licensed launch ramps inside fee marinas are not all public.

Sources and dates

Canal outlines, SALT/FRESH classification and nav systems: City of Cape Coral GIS (cc_canals), snapshot 2026-09-13. Route graph, exits and bridge clearances: City bridge inventory + OpenStreetMap geometry, routes v3 built 2026-07-08. Flood zones: FEMA generalized zone export, snapshot 2026-09-13. Utility water-service boundaries: City of Cape Coral, snapshot 2026-09-15. Marinas: OpenStreetMap Overpass API (ODbL), snapshot 2026-09, 5 points. Boat ramps: OpenStreetMap Overpass API (ODbL), retrieved 2026-10-01, 63 points (24 mapped only in OSM, 22 from the FWC inventory, 17 in both). Ramps cross-check: FWC Florida Boat Ramp Inventory, FWC-FWRI, published keyless as an ArcGIS layer, retrieved 2026-10-01, 48 rows in this area, of which 39 are Open for Business and 9 are temporarily or permanently closed and were dropped. 22 ramps mapped by FWC were not in OpenStreetMap and were added from the inventory, and 17 points within 60 m matched and were merged, keeping the OpenStreetMap geometry. 16 of the open FWC rows are kayak and canoe hand launches and are included with the type named in the popup. Attribution: Florida Fish and Wildlife Conservation Commission, Fish and Wildlife Research Institute. That inventory is a public record and a planning dataset, not a survey, and FWC does not publish it for navigation. Fuel docks: OpenStreetMap Overpass API (ODbL) waterway=fuel, retrieved 2026-10-01, 2 points, both unnamed in OpenStreetMap. Tides: NOAA CO-OPS station 8725418 (Iona Shores, Caloosahatchee River), fetched live at view time.

What this map does not cover: water depth, dredging or maintenance status, mast or bridge clearance as a fact at a given tide, the state river bridges named above, ramp fees, hours or current open status, ramp lane count or surface condition at the day you launch, and fuel prices, hours or current availability at any dock. The two fuel points carry no published name in OpenStreetMap, so we show them as unnamed mapped fuel docks and do not guess which business they belong to. The ramp layer is a map of public and semi-public launch points, not a guarantee that a ramp is open, usable at low tide, or free. Marinas and ramps shown are mapped points, not endorsements. Clearance and route numbers are mapped starting points, not survey figures.

Route-time estimates use a constant 5 mph and are not a navigation guarantee. Our Cape Coral canal system guide explains direct gulf access, indirect gulf access, and freshwater before you compare a specific dock and route.

Looking for a Cape Coral canal map with names? Start with an address.

This free map labels Cape Coral canals by name and classes each one as saltwater or freshwater from City of Cape Coral GIS data, with the bridges, flood zones and utility service areas around it. Type an address or a canal name and it routes that dock toward open water.

A waterfront address is not a boating answer. The dock, the canal network, the bridges, and the route to open water all matter. A freshwater canal does not connect to the Gulf. A saltwater route may have a fixed bridge that rules out a tall vessel. Begin with an address in the map, then verify the result before you make an offer.

Two homes on the same street can have very different boating access. Ask for the lowest bridge on the actual route, the boat's height including anything above the deck, and the current navigability of the canal. A route estimate on this page is a starting point, not a promise of depth or clearance at a particular tide. For recorded City clearances grouped by area, see the Cape Coral bridge clearance table.

Start with an address.

Understand the three networks ↗

Back to the Cape Coral guide ↗

Direct gulf access, indirect gulf access or freshwater: which canal is yours?

Cape Coral has more than 400 miles of canals, according to the City, and this map puts each one in one of three classes. “Waterfront” can describe a direct Gulf route, a route under fixed bridges, or an inland freshwater system. The classification is only part of the decision. The individual route, vessel, and current conditions determine whether a property works for you.

01 · Direct gulf access

Saltwater, with no fixed bridge on the route.

A route from the dock to open water without a fixed bridge can work for taller vessels, but the available depth and the actual path still need confirmation. “Sailboat access” is an MLS shorthand, not a clearance guarantee. Check the canal entrance, turning space, and the details of your boat before relying on a listing label.

02 · Indirect gulf access

Saltwater, with a bridge or another route constraint.

The water connects toward the river or Gulf, but a fixed bridge on the route may limit vessel height. Clearance signs, tidal conditions, and the lowest bridge matter more than the name of the canal. The former Chiquita Lock was removed in June 2025; do not confuse that removed lock with the fixed bridges that remain elsewhere.

03 · Freshwater

Canal views, without a Gulf connection.

Freshwater systems can be useful for paddling, fishing, and a quieter water view, but they do not provide a boating route to the Gulf. In the City canal data this map uses, freshwater canals appear in all four quadrants on our area map, and every canal we map in the northeast quadrant is freshwater. Do not infer the type from a neighborhood alone: verify the specific parcel and waterway.

Listings can use “gulf access,” “sailboat access,” and “waterfront” differently. Treat the route from the exact dock to open water as the question, not the label on the search card.

Cape Coral canals in plain numbers: which water reaches the Gulf, how long it takes, and which bridges you pass

  • Bridges on the way out46.5%

    of routed saltwater canals pass at least one fixed City bridge, so they are indirect gulf access.

    293 of 630 canals.

    Source: City of Cape Coral canal and bridge data, July 6, 2026; computed October 15, 2026. How we counted
  • Lowest bridge on those routes8.9ft

    is the median lowest recorded clearance on the 293 indirect gulf access routes: measure your boat against it.

    19 routes pass a bridge with no recorded clearance; not a verified height limit.

    Source: City of Cape Coral canal and bridge data, July 6, 2026; computed October 15, 2026. How we counted
  • Run to open water23min

    is the median modeled run from a saltwater canal to its mapped exit at a constant 5 mph.

    90 percent within 75 min, across 630 canals. Planning data; the Gulf is farther.

    Source: City of Cape Coral canal and bridge data, July 6, 2026; computed October 15, 2026. How we counted

Our canal layer maps 378.8 miles of Cape Coral canal centerline: 104.7 miles of direct gulf access, 112.5 miles of indirect gulf access, 160.6 miles of freshwater and 0.9 miles unclassified. Across 630 routed saltwater canal polygons, the median modeled route-start-to-exit run is 23 minutes, and 90 percent are within 75 minutes, at an assumed constant 5 mph. These are times to the mapped exits, not to the Gulf.

Canal data: City of Cape Coral GIS snapshot 2026-07-06; routes built 2026-07-08; computed 2026-10-15. Times are planning data at a constant 5 mph, not navigation times. How we counted.

Facts you can quote, each with its date and method

  1. In southwest Cape Coral, the median modeled run from a direct gulf access canal to open water is 18 minutes.As of 2026-10-15 (City GIS 2026-07-06) · method
  2. In southeast Cape Coral, the median modeled run from a direct gulf access canal to open water is 8 minutes; from an indirect gulf access canal it is 26 minutes.As of 2026-10-15 (City GIS 2026-07-06) · method
  3. Every routed saltwater canal in northwest Cape Coral reaches open water at Matlacha Pass; the median modeled run there is 63 minutes, and the 90th percentile is 92 minutes.As of 2026-10-15 (City GIS 2026-07-06) · method
  4. Every mapped canal mile in northeast Cape Coral is freshwater (35.5 miles), so no canal there has a mapped boat route to the Gulf.As of 2026-10-15 (City GIS 2026-07-06) · method
  5. 46.5 percent of routed saltwater canals (293 of 630) pass under at least one fixed City bridge on the way out, which makes them indirect gulf access.As of 2026-10-15 (City GIS 2026-07-06) · method
  6. The stored routes list 40 distinct fixed City canal bridges; the median recorded clearance is 9.0 ft, and 17 of the 38 with a recorded clearance are under 9 ft. The City field does not state a water-level datum.As of 2026-10-15 (City bridge inventory snapshot 2026-07-06; stored routes v3) · method
  7. For the 293 indirect gulf access canals, the median lowest recorded bridge clearance on the selected route is 8.9 ft, and 59.0 percent have a recorded bridge under 9 ft. Missing bridge values on 19 routes mean these minima are not verified height limits.As of 2026-10-15 (City GIS 2026-07-06) · method
  8. Of 630 routed saltwater canals, 331 reach open water on the Caloosahatchee River, 180 through the South Spreader Waterway, 118 at Matlacha Pass and 1 at Buccaneer Basin.As of 2026-10-15 (City GIS 2026-07-06) · method
  9. Beyond the canal exits, the saved NOAA chart extract lists both the Cape Coral Bridge and Midpoint Memorial Bridge at 16.7 meters (54.8 ft) of vertical clearance. The Coast Pilot lists the Cape Coral Bridge at 55 ft at the center; these are different publication units, not conflicting canal-bridge measurements.As of 2026-10-15 (NOAA ENC saved extract 2026-02-13; Coast Pilot 5 chapter 4 fetched 2026-10-15) · method
  10. The City marks the Chiquita Lock Removal Project complete on June 17, 2025, when dredging equipment and turbidity barriers were removed. It warns that shallow areas may remain; lock removal is not a depth guarantee.As of 2026-10-15 (City of Cape Coral news, June 17, 2025; fetched 2026-10-15) · method

Quadrant by quadrant

Miles are mapped canal centerline by class (direct gulf access, indirect gulf access, freshwater). Minutes are modeled to the mapped exit at 5 mph. As of 2026-10-15 (City GIS 2026-07-06).
QuadrantDirectIndirectFreshwaterCanalsMedian90th pctDirect / indirect
mimimirouted saltwaterminminmedian min
Southwest29.664.845.7271398018 / 56
Southeast55.236.535.928510338 / 26
Northwest19.711.042.474639271 / 61
Northeast0.00.035.50–––
Citywide104.7112.5160.6630237512 / 46

The bridges between your canal and open water

Bridged canals are routed saltwater canals with at least one fixed City bridge on the stored route; lowest bridge is the median of each route's lowest recorded clearance; bridges here are route bridges standing in that quadrant. Recorded clearance in feet (City Public Works inventory, water-level datum unspecified). As of 2026-10-15 (City GIS 2026-07-06).
QuadrantBridged canalsLowest bridgeBridges hereClearanceUnder 9 ftUnder 8 ftExit water
of routed (share)ft, mediancountft, medianof recordedof recordedcanals by exit
Southwest162 of 271 (59.8%)8.9239.010 of 231 of 23South Spreader Waterway 180, Caloosahatchee River 46, Matlacha Pass 44, Buccaneer Basin 1
Southeast101 of 285 (35.4%)9.0149.34 of 120 of 12Caloosahatchee River 285
Northwest30 of 74 (40.5%)8.938.93 of 30 of 3Matlacha Pass 74
Northeast––0–––No saltwater route
Citywide293 of 630 (46.5%)8.9409.017 of 381 of 38Caloosahatchee River 331, South Spreader Waterway 180, Matlacha Pass 118, Buccaneer Basin 1

Bridge counts cover the 40 City canal bridges our routes pass under, out of 159 records in the City inventory snapshot; 19 routed canals pass a bridge with no recorded clearance. Lowest recorded values omit missing clearances and are not verified boat-height limits. A canal counts by a representative point of its polygon; a bridge counts where it stands. The map stats above count displayed markers near saltwater and freshwater canals, not these unique route crossings. Want the full list? Check the clearance of every City canal bridge.

By ZIP code

Same units as the quadrant table. ZIP outlines from our area map; a ZIP can span quadrants. As of 2026-10-15 (City GIS 2026-07-06).
ZIPDirectIndirectFreshwaterCanalsMedian90th pct
mimimirouted saltwaterminmin
3390446.025.40.0242927
339090.00.048.10––
3391422.355.412.42264883
339909.810.723.2432439
339913.93.429.1171422
3399322.617.546.51025586

The Chiquita Lock is gone

The City of Cape Coral removed the Chiquita Lock; dredging equipment and turbidity barriers at the lock were removed on June 17, 2025, completing the Chiquita Lock Removal Project. The City urges boaters to use caution near the lock removal area because shallow areas may be present, and lists a bathymetric survey of the South Spreader and city-wide dredging permits as next steps. Source: City of Cape Coral, fetched 2026-10-15. For this summary, listed fixed bridges distinguish direct from indirect gulf access. Depth, tide and other obstacles still need checking.

Questions people ask about Cape Coral canals

Where can I find a Cape Coral canal map with names?

The waterway map at the top of this page shows mapped canal names and access classes from City of Cape Coral GIS data. Search a canal name or an address to check its modeled route and listed bridges. Freshwater canals do not have a modeled boat route to the Gulf. The map is free and is a planning tool, not a navigation chart.

How many miles of canals are in Cape Coral?

The City of Cape Coral says more than 400 miles. Our generated centerlines measure 378.8 miles: 104.7 miles of direct gulf access, 112.5 miles of indirect gulf access, 160.6 miles of freshwater and 0.9 miles unclassified. This is a measurement of our layer, not a replacement for the City figure.

Are the canals in Cape Coral freshwater or saltwater?

Both. In our canal layer, 217.2 of 378.8 mapped miles are saltwater with a stored route to an exit, 160.6 miles are freshwater with no modeled boat route to the Gulf, and 0.9 miles are unclassified. Freshwater occurs in all four mapped quadrants; mapped canals in the northeast quadrant are freshwater.

What is the Cape Coral boating time to the Gulf?

Our model times the run from each selected canal route start to its mapped exit at the Caloosahatchee River, South Spreader Waterway, Matlacha Pass or Buccaneer Basin, at an assumed constant 5 mph. Across 630 routed saltwater canals, the median is 23 minutes and the 90th percentile is 75 minutes, rounded. These are not times to the Gulf: the onward trip adds time, and actual travel depends on the starting dock, boat, tide, currents and speed zones.

What does gulf access mean in Cape Coral?

A saltwater canal with a modeled connection to an exit leading toward the Gulf. For this summary, direct gulf access means the selected route lists no fixed City canal bridge; indirect gulf access means it lists at least one. Of the selected saltwater routes, 46.5 percent are indirect. No fixed bridge does not guarantee sailboat access: depth, tide, other obstacles and your boat still matter, and an address-specific route can differ from this canal-level summary.

How high are the bridges in Cape Coral?

The 40 distinct fixed City canal bridges listed on the stored routes have 38 recorded clearances: the median is 9.0 ft and the range is 7.9 to 11.75 ft; 17 are under 9 ft. The full City inventory is a different population: 159 records, 122 recorded, ranging from 5.5 to 11.75 ft with a median of 8.0 ft. The City field does not specify a water-level datum. NOAA chart clearances use mean high water unless noted otherwise; higher water leaves less room. Check actual conditions and the full height of your boat.

How we counted

Modeled times are planning data at a constant 5 mph, a modeling assumption rather than a claim about legal or actual speed. Each time runs from the start of a canal's selected precomputed route to its exit point at the Caloosahatchee River, South Spreader Waterway, Matlacha Pass or Buccaneer Basin. These are route-start-to-exit times, not dock-to-Gulf times or navigation instructions. They exclude the onward run to the Gulf, currents, tide, depth, weather and speed-zone changes.

For these aggregates, direct gulf access means a City SALT canal whose selected precomputed route lists no fixed City canal bridge; indirect gulf access means it lists at least one. Freshwater means City FRESH, with no modeled boat route to the Gulf. Of 959 City polygons, 630 are SALT, 328 FRESH and 1 UNKNOWN, across 921 distinct names. We select the shortest stored route for each SALT polygon: 337 direct and 293 indirect. The 647 raw route records include 345 without bridges, 302 with bridges and one UNKNOWN-water route excluded from this saltwater summary. A canal can have several variants; an address lookup selects a route for its location, so its class and time can differ from this canal-level summary. The 0.9 mi on the UNKNOWN canal stays unclassified. These are map classifications, not guarantees of navigability or sailboat clearance.

Geodesic WGS84 length of our generated canal centerlines (Voronoi skeleton of City canal polygons), not shoreline length or an independent City survey. Area miles are clipped to quadrant and ZIP outlines. Of 378.8 mi, 377.2 fall within the four quadrant outlines; rounding individual classes can make displayed totals differ by 0.1 mi. The class split includes 0.9 mi unclassified.

One equally weighted value per routed saltwater canal polygon, using the shortest stored variant where several exist. Times are recomputed from stored distance divided by 5 mph, not the already rounded time_min field. Median is the middle value (the mean of the middle pair for an even count); the 90th percentile is nearest rank. Times are displayed to the nearest whole minute. The unrounded citywide median is 22.62 minutes and the 90th percentile is 74.52 minutes. The separate guide's 12 / 45.5 minute medians describe all raw direct / indirect route records, not this deduplicated saltwater population (12 / 46 minutes displayed).

Quadrant and ZIP outlines from our area map files; a canal counts in the area holding a representative point of its City polygon. A ZIP can span quadrants.

The 40 distinct fixed City canal bridge entries listed across stored routes are a subset of the 159 City inventory records, not the map's broader displayed-marker count. Its stats line counts visible markers near both saltwater and freshwater canals, not unique bridges crossed by these stored routes. City clearance values are recorded feet; the City source field does not identify a vertical datum, so we do not assume mean high water. NOAA chart and Coast Pilot clearances are above mean high water unless otherwise stated. Higher water reduces available room. Lowest recorded bridge statistics ignore missing values: 19 selected routes include an unrecorded clearance, so their actual lowest clearance is not established. River crossings are outside the canal-route bridge population. No figure guarantees clearance for a boat.

Each route end is assigned the water body of the nearest point among 23 owner-final exit points; the largest match distance is 152.6 m. South Spreader Waterway and Buccaneer Basin are named exit targets, not the open Gulf; time beyond any exit is excluded.

The City of Cape Coral says it has more than 400 miles of canals. Source: City of Cape Coral boating page, fetched 2026-10-15. Our smaller figure measures canal centerlines in our map layer, not the City's count.

Source files and SHA-256 (first 12): data/cape-coral-routes-v3.json 831dd1a3419f, data/cape-coral-waterways-v2.2.json 1af066c7e964, data/canal_exits_canonical.json ec4e7c60229c, data/gen6-bridges.json 189aaa317e2f, data/cape-coral-noaa-bridges-area.json 4897cef0e33c, data/cape-coral-quadrants.geojson 76489246714f, data/cape-coral-zips.geojson ba4112be2f3d. Generated 2026-10-15T21:16:01+00:00 by build_canal_text_facts.py. River bridge clearances: saved NOAA electronic chart cells US5FL3NM.000, US5FL3ON.000, US5FL3NN.000, chart clearances in meters. NOAA Coast Pilot chapter 1 states the mean-high-water convention; chapter 4 lists the Cape Coral Bridge at 55 ft at the center. Both fetched 2026-10-15. Saved ENC features have source dates from 2013 to 2016; the 2026 extract date is not a new hydrographic survey.
What should you check before you make an offer on a canal home?

  • Canal classification and route. Confirm whether the property connects to the Gulf, whether the route passes a bridge or other obstacle, and where the route reaches open water. Compare the listing, parcel map, and current local records.
  • Bridge clearance and vessel fit. Find the lowest fixed bridge on the route and compare it with the boat's air draft. Signposted clearance and actual clearance can vary with conditions; confirm directly before making a boating decision.
  • Depth, tides, and navigation. A route visible on a map does not establish usable depth. Ask about shallow areas, seasonal changes, and dredging or maintenance advisories. Verify with the appropriate local authority and a qualified marine professional.
  • Seawall, dock, and lift. Inspect the seawall and dock and verify permits and lift capacity. Obtain estimates for any work instead of using a generic repair price as a property-specific fact.
  • Flood and insurance. Check the current FEMA map, an elevation certificate if available, insurance quotes, and the property's actual history. Flood zone alone does not determine the full cost.
  • Access on the day you go. Confirm current notices, construction, tides, weather, and marine safety. This tool is not a navigation chart.

We can work through the map with you, then identify what needs a survey, inspection, insurer, marine professional, or city confirmation. The offer should reflect what you can verify about this address.

The map answers the boat. These pages are the houses.

Route the address here, then open the live MLS inventory for that kind of water. The list changes through the day. The route stays on this map.

Cape Coral gulf-access homes ↗

All Cape Coral homes for sale ↗

Flood zone on the same map set ↗

Talk to the team.

Bring the address. We will run the route, the zone, and the houses that fit it.

(239) 895-9383

Prefer to pick a time? Book directly with an agent, or call and we will sort it out on the spot.

The Milner Team, led by Brayden Milner. Brokered by Florida Future Realty, Inc.

Who would you like to talk with?

Request a callback from The Milner Team.

Continue to request form ↗

A few quick taps: selling, buying or both, your timing and how to reach you. We pass your choice of agent along with it. To lock a specific time instead, book with an agent.