

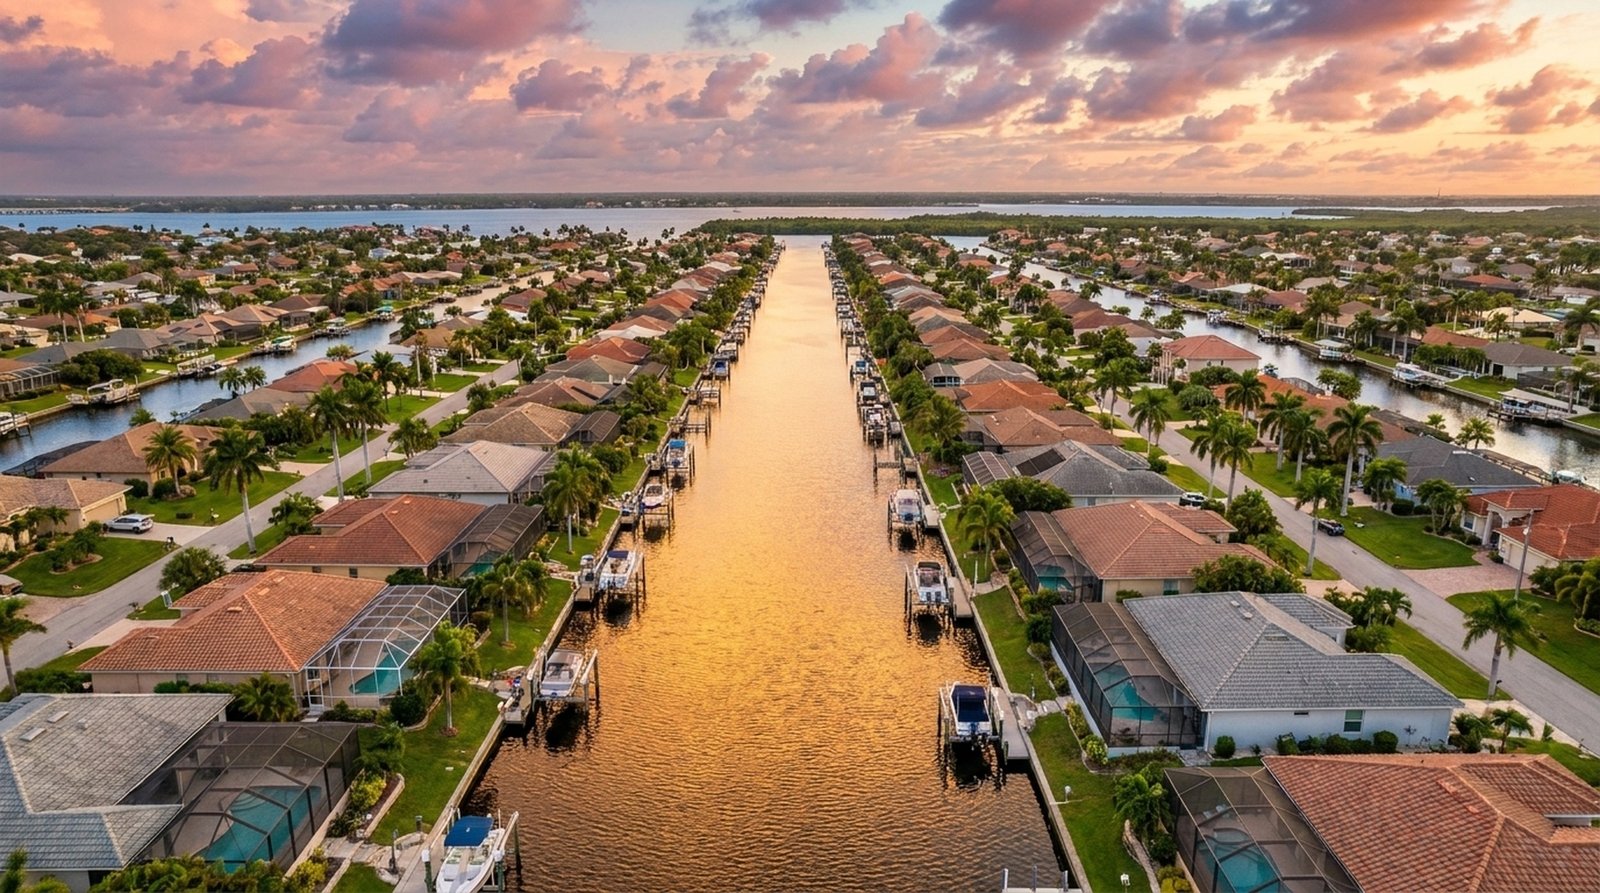
Cape Coral Real Estate Market Report, June 2026
I’m Brayden Milner, a third-generation Cape Coral Realtor with Milner Team. I’ve been watching this market since I was a kid, and June 2026 delivered some of the clearest buyer-leaning signals we’ve seen in years. Here’s what the data shows.
Source: The Milner Team’s weekly SWFL MLS market tracking (weekly rows 2026-06-01 through 2026-06-29). Mortgage rates from the Freddie Mac Primary Mortgage Market Survey (PMMS, released each Thursday; each rate below is the PMMS reading published during that Monday-dated MLS tracking week). Data reflects the broader Southwest Florida market, Cape Coral moves with this region but can vary by neighborhood.
Median Prices, Volatile Week to Week, Ending Near the Middle
Single-family home medians in the SWFL market swung hard during June. The weekly single-family median ran $419,000 (week ending June 8), $435,000 (June 15), $380,000 (June 22), and $394,000 (June 29). The week ending June 1 had no single-family median reported in the dataset.
That mid-June peak of $435,000 was the high, and the late-June dip to $380,000 was the low, a $55,000 swing in three weeks. The month closed at $394,000, right in the middle of that range.
For all property types (condos, townhomes, single-family combined), the median held at $350,000 for the weeks ending June 1, June 8, and June 29, with a bump to $370,000 on June 15 and a dip to $345,000 on June 22.
What this tells me: the market is pricing homes more selectively. Big outlier sales in one week can spike the median, and when those weeks don’t repeat, the number drops. That’s not a crash, it’s a market where every deal is negotiated on its own terms.
Sales Volume, Steady Through the Month
Closed sales in the SWFL market ran 385 (week ending June 1), 294 (June 8), 258 (June 15), 258 (June 22), and 319 (June 29), totaling roughly 1,514 closings across the five weekly rows. The busiest stretch was the first week of June, and the slowest was the middle two weeks at 258 each.
That volume tells you two things: (1) people are still buying homes in Southwest Florida with rates in the mid-6% range, and (2) the market is liquid enough that well-priced properties move without sitting. Even at the slowest point of the month, more than 250 properties changed hands in seven days.
New Supply and Expired Listings, Sellers Adjusting
New listings came in at 312 (June 1), 466 (June 8), 324 (June 15), 318 (June 22), and 296 (June 29). The second week of June was the outlier, 466 new listings in seven days, against 1,716 new listings for the whole month, means roughly a quarter of June’s new supply hit in a single week. That flood of competition is exactly why pricing matters so much right now.
The flip side of that story is expired listings, which ran 238 (June 1), 94 (June 8), 84 (June 15), 72 (June 22), and 56 (June 29). The first week’s 238 expirations was unusually high, a batch of overpriced listings that finally hit their time limit. By month’s end, expirations had dropped to 56, suggesting sellers who relisted did so at more realistic prices.
Price reductions were also widespread: 642 (June 1), 490 (June 15), 487 (June 22), and 585 (June 29). The week ending June 8 has no price-reduction figure in our tracking dataset, so it is omitted rather than estimated. When nearly 500-600 listings drop price in a single week, that’s sellers acknowledging the market won’t carry them.
Pending Contracts, Demand Holding
Pending contracts ran 367 (June 1), 409 (June 8), 294 (June 15), 302 (June 22), and 354 (June 29). The lowest point was 294 in mid-June, but even that means nearly 300 homes under contract in a single week. Demand isn’t gone, it’s just more selective.
Mortgage Rates, A Tight Band
Rates held in a narrow range all month: 6.58% (June 1), 6.68% (June 8), 6.56% (June 15), 6.66% (June 22), and 6.52% (June 29). The Freddie Mac PMMS showed rates never broke above 6.68% or below 6.52% during June, a 16-basis-point spread. That stability gave buyers a predictable financing environment, even if the numbers aren’t historically cheap.
What This Means for You
For Buyers
- Price reductions are your friend: 500-600 price drops per week means sellers are negotiating. Don’t be afraid to make an offer below asking on homes that have been sitting.
- Rate predictability: Rates held between 6.52% and 6.68% all month. If you’re pre-approved, you can lock in today’s rate and refinance later if rates fall. The cost of waiting for a “perfect” rate is often higher than the rate itself.
- Volume is still there: Over 1,500 closings in the SWFL market during June means there’s activity to participate in, you just need to know which properties are priced to move.
For Sellers
- Price it right the first time: The 238 expired listings in the first week of June were the clearest signal, overpriced homes hit a wall. The sellers who relisted at realistic prices saw their homes get under contract in the weeks that followed.
- Mid-June was the peak: If you’re thinking of listing, the second week of June saw 466 new listings hit the market, that’s when competition was highest. Timing matters, but pricing matters more.
- Buyers are still buying: 1,514 closings in a month means demand exists. It just won’t carry an overpriced home.
Bottom Line
June 2026 was a buyer-leaning month in Southwest Florida. Expired listings and price reductions cleared out overpriced homes. But sales volume stayed solid, over 1,500 closings, and pending contracts never dropped below 290 in any given week. The market isn’t broken. It’s just more selective.
If you’re buying, now is the time to be aggressive on price. If you’re selling, price it right from day one or you’ll be one of the expired listings. Either way, the data is clear, and I’m here to help you navigate it.
Data source: The Milner Team’s weekly SWFL MLS market tracking (weekly rows 2026-06-01 through 2026-06-29). Mortgage rates: Freddie Mac Primary Mortgage Market Survey. All figures reflect the broader Southwest Florida market including Cape Coral and surrounding Lee County areas.