

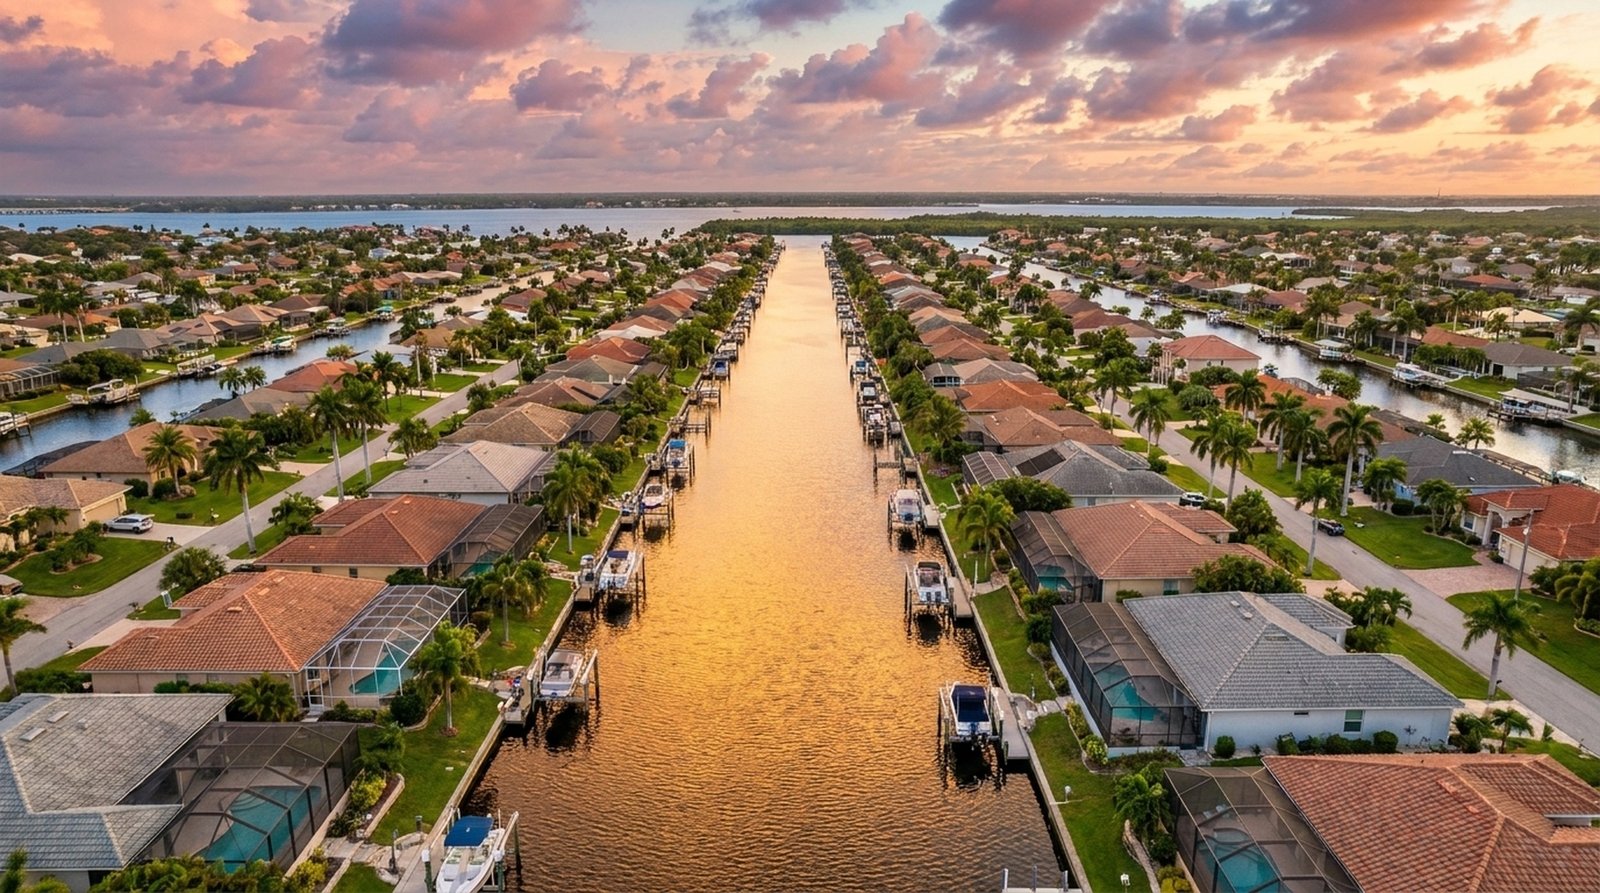
SWFL Market Update – Sept 28, 2026
This is the SWFL Market Update for the week of September 28, 2026. Every week I pull the MLS numbers for the three cities we work every day – Cape Coral, Fort Myers, and North Fort Myers – and put them in plain English.
Source, window, and what these numbers are not
Source: The Milner Team weekly SWFL MLS tracker, one internal file (swfl_market_stats.csv) updated each Monday from Trestle RESO OData and our IDX mirror. Every figure below is a row from that file. The file itself is internal – I am not publishing it – but the method is reproducible: a single continuous weekly series, each row carrying one date, and I am comparing two named rows.
If you want to check any number here, ask me and I will send you the dated rows. That offer is real; it is how I would want to be treated if someone quoted a market statistic at me.
On the mortgage rate specifically: the tracker records a 30-year fixed figure for each week, and 6.95% is that recorded value. The file does not state which index or lender survey it came from, and I do not hold a public citation for its upstream source. So treat the rate in this update as this tracker’s recorded figure, not as a named national index.
Window definition: this update compares the row dated 2026-09-21 against the row dated 2026-09-14. Both rows use the same label convention, so the comparison is like-for-like. Honest caveat: the tracker does not say whether that date is the week’s start or its end, and this snapshot was pulled on 2026-09-26. If the label means week start, the 09-21 row covers a week that had not closed when I pulled it and could still be revised. I cannot settle that from the file. Read the 09-21 figures as the tracker’s latest recorded values, not as final ones.
Geography and property types: Cape Coral + Fort Myers + North Fort Myers; single-family, condo, townhouse and multifamily; land and rentals excluded.
What the columns mean: closed sales and new listings are counts of events recorded in that week. Price reductions counts listings whose asking price was cut in that week. Pending is one figure per row, and I want to be straight about its limit – the tracker does not state whether that is new pending contracts signed during the week or the count of listings pending at the moment of recording. So read pending as a weekly recorded level.
Unavailable in this tracker – not recorded, which is not the same as zero: active-listing count, expired-listing count, and any per-city or per-price-band breakdown. No figure below is a per-city number, because the tracker does not carry one.
The week in one list (09-21 vs 09-14)
- Closed sales: 189 vs 135, up 54
- New listings: 249 vs 252, down 3
- Pending: 176 vs 184, down 8
- Price reductions: 638 vs 527, up 111
- Median sale price, all types: $365,000 vs $315,000
- Median sale price, single-family: $408,500 vs $380,000
- 30-year fixed rate (tracker): 6.95% vs 6.76%, up 0.19 point
Closed sales: 189, up off the low end
189 homes closed in the week dated September 21, against 135 in the week dated September 14. That is 54 more closings.
I am not going to call that a strong week. Across the last 12 rows the range runs from 135 to 410, so 189 sits in the lower half of that range – better than the week before, and still nearer the low than the high. One week is not a trend, and a week in the bottom half of its own range is not evidence of a market turning.
Price reductions: 638, the busiest single number here
Sellers cut asking price on 638 listings in the week dated September 21, against 527 the week before – 111 more.
What the data supports: across the last 11 rows carrying a price-reduction count, the weekly figure runs from 143 to 757 with an average near 507. At 638 this week is above that average and below the high. A busy week, not a record.
What the data does not support: this column counts price-cut events. It does not tell me why any seller cut, how large the cut was, whether the home then sold, or what the seller netted. The ratio of price cuts to closings gets described sometimes as the cost of overpricing. That is an interpretation laid on top of the number – a reasonable one, but not something this file measures. I would rather hand you the count and be clear about where the counting stops.
Median prices: $365,000 all types, $408,500 single-family
All types: $365,000 in the week dated September 21, against $315,000 the week before. Single-family only: $408,500, against $380,000 – so the single-family median rose above $400,000 this week, having been below it the week before.
The all-types median moved further than the single-family median. Worth flagging, and worth being precise about how little I can claim. A median is a midpoint: it moves with the mix of what closes as well as with price. This tracker carries the two median columns and no breakdown by property type or price band, so I cannot show you a mix table, and I am not going to assert that mix explains all of it. What I can say: the prior week’s all-types median of $315,000 was the lowest of the last 12 rows, and this week is a move off that low. Across those 12 rows the single-family median has ranged $365,000 to $445,000. Read the range, not the week.
New listings and pending: 249 new, 176 pending
New listings came in at 249, against 252 the week before – effectively flat. Pending sales were 176, against 184.
New listings across the last 12 rows range from 219 to 402, and the only row above 400 in that window is the one dated 2026-07-06. That is what I can show: this is a slower stretch than early July. Whether to call it seasonal is a judgement about Southwest Florida’s calendar rather than something this file measures, so I will point you at the July row instead of handing you a label.
Pending drifting down while closings rise is consistent with deals signed earlier now reaching the closing table. The tracker does not link individual pending rows to individual closings, so I am describing two series moving side by side, not proving a chain.
Mortgage rate: 6.95% in the tracker
The 30-year fixed rate recorded for the week dated September 21 is 6.95%, against 6.76% the week before. The lowest rate across the last 12 rows is 6.49%, in the row dated 2026-07-06, so rates in this series have drifted up since early July. As above, that is the tracker’s recorded figure; I do not have its upstream source.
Payment math at 6.95%: roughly $662 per month per $100,000 borrowed, principal and interest only. That is arithmetic from the rate, not a lender quote, and it excludes taxes, insurance and HOA. At 6.76% the same $100,000 was about $649.
What I am telling my clients this week
For sellers: 638 price cuts against 189 closings. Strip out any headline and the plain fact is that a lot of sellers repriced this week. My own practice is to push for a strong day-one price, because the early weeks are usually when a listing gets its heaviest showing traffic – that is how I work listings, not something this tracker proves. If your home has been sitting past 30 days without an offer, the useful move is to look at what has actually closed near you rather than at what is currently asking. And I will not tell you this week’s city-wide data proves what your house is worth; that takes the comparables for your street, which I would rather pull than estimate.
For buyers: pending slipped and new listings are flat. Nothing in this week’s numbers argues for rushing. Where a listing has already cut its price, there is usually more room to talk than on a fresh one – again, that is how I negotiate, not a fact this file establishes. The tracker also cannot tell you whether that applies to a particular neighborhood, because it carries no area breakdown; ask me and I will look at the actual comparables for that area. What the numbers do show is that single-family homes are still closing and the median moved up this week. What they do not show is how any specific listing will perform, and I will not pretend otherwise.
Get the numbers for your property
These are tri-city numbers. Every neighborhood and price band tells a different story.
- Considering selling: see how we list and price a home
- Wondering what your home is worth: get a home value read
- Want to browse what is on the market: search SWFL homes for sale
- Want to talk it through: schedule a free consultation