

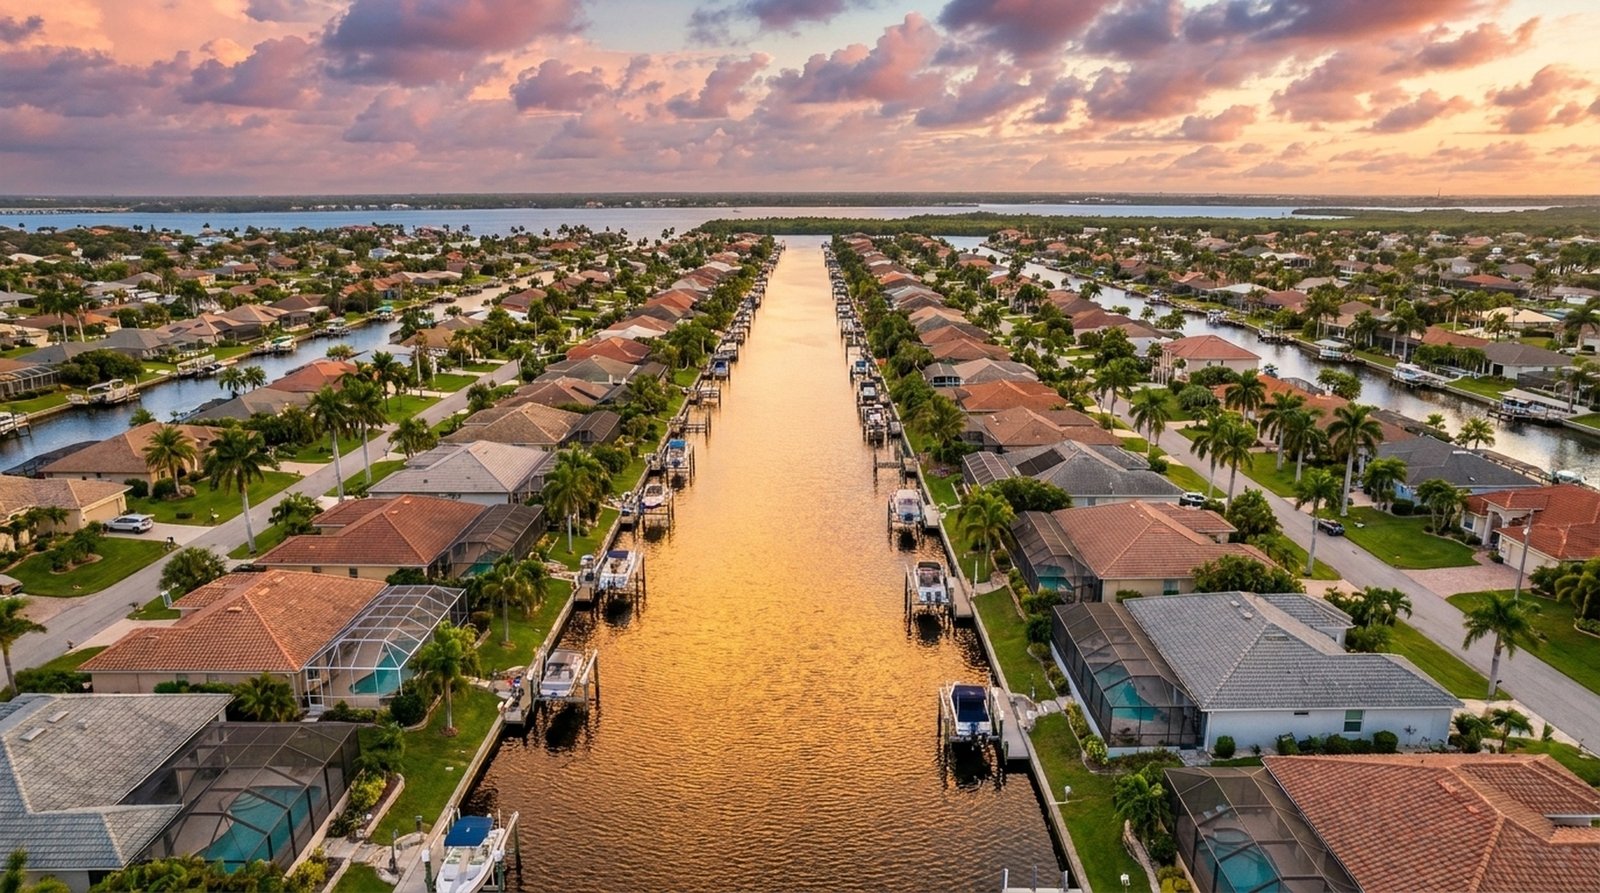
This is the SWFL Market Update for Monday, October 19, 2026. Every week I pull the MLS numbers for the three cities we work every day (Cape Coral, Fort Myers and North Fort Myers) and put them in plain English: what changed, what it means if you are buying or selling, and one thing to do about it.
The short version: the market held its shape. Sellers kept cutting at almost exactly last week’s pace, closings ticked up a little, and the 30-year rate did not move. The one number that jumped is the single-family median, and I will explain why I am not reading much into it yet.
The window and the source
Every figure below comes from The Milner Team weekly tracker, built from the MLS (Trestle) feed and our own IDX listing mirror. This week’s row was recorded the morning of October 19 and covers the seven days from October 12 to October 19. I compare it with the prior row, dated October 12. Scope is Cape Coral, Fort Myers and North Fort Myers; single-family, condo, townhouse and multifamily; land and rentals excluded. Closed sales are counted by closing date inside the window, new listings by list date, pending as listings that went under contract inside the window, and price reductions as distinct listings whose asking price was cut inside the window.
The mortgage rate is Freddie Mac’s Primary Mortgage Market Survey 30-year fixed average, published October 15. Expired listings, active inventory and per-city splits are not in this tracker. That means unavailable, not zero, so you will not see a number for them here.
|
SWFL Weekly Market Update
Week of 2026-10-19 · The Milner Team |
||||||||||||||||||||||||||||||||||||||||
|
||||||||||||||||||||||||||||||||||||||||
4-Week Trend
|
||||||||||||||||||||||||||||||||||||||||
|
30-Yr Fixed Mortgage Rate: 7.4% (0.00% vs last week)
Scope: Cape Coral · North Fort Myers · Fort Myers (SFH, condo, townhouse, multifamily; land & rentals excluded). Source: Trestle MLS + owned IDX tracker. Compiled by The Milner Team. |
Price reductions: 601, the same story as last week
Sellers cut asking prices on 601 listings this week, against 604 the week before. Down 3, which is flat. Over the last twelve weekly rows (August 3 through October 19) the count has run from 323 to 757, so 601 sits in the upper half of that range. Put it next to closings and you get the plainest fact in this update: 601 price cuts against 176 closings, roughly three and a half cuts for every home that closed.
What that number does not tell you: how big the cuts were, or whether those homes then sold. It counts repricing, not outcomes.
Closings 176, pending 174, new listings 277
176 homes closed this week, up 8 from 168. 174 went under contract, down 5 from 179. 277 new listings hit the market, down 10 from 287. All three moved by single digits or close to it. That is a steady week, not a turn in either direction. For context, closings over the same twelve rows ranged from 135 to 246.
Medians: single-family up, all types down
The single-family median closed price was $425,000, against $395,000 the week before. The all-types median went the other way: $340,000, against $357,400.
Two medians moving in opposite directions in the same week is the giveaway. A median is the middle sale of whatever closed, so it moves with the mix of homes as much as with prices. With 176 closings in a week, a handful of higher-end single-family sales can lift that median while more condos pull the all-types figure down. The tracker does not break sales out by price band, so I cannot prove the mix explanation, and I am not going to tell you single-family values rose this week. The range is the honest read: over the last twelve rows the single-family median has run from $380,000 to $445,000.
Rates: holding at 7.40%
Freddie Mac’s 30-year fixed average was 7.40% in the October 15 survey, the same as the week before. Those two weeks are tied for the highest rate in our twelve-row window. The low in that window was 6.65%, recorded the week of August 24.
Payment math at 7.40%: about $692 a month per $100,000 borrowed, principal and interest only. At 6.76%, the rate on our September 14 row, the same $100,000 was about $649. That is arithmetic from the rate, not a lender quote, and it leaves out taxes, insurance and HOA.
What this means for you
If you are selling: roughly three and a half price cuts for every closing tells you buyers are choosy and comparing hard. The price you launch at matters. If your home has sat through several weekends of showings without an offer, the market has given you feedback, and it is worth sitting down with your agent and the recent closed sales near you before the next weekend.
If you are buying: rates are high and steady, and sellers are repricing at a steady clip. That combination is the setup for negotiating. Homes that have already taken a cut are where the conversation on price and seller credits is most open, and at today’s rates it is worth asking your lender whether a seller credit toward a rate buydown helps your monthly payment more than the same dollars off the price.
The one takeaway
Do not read one week’s median. Read the ratio. As long as price cuts run at three-plus per closing, buyers have room to ask and sellers need a price that competes from the first showing.
Want the numbers for your street or your price range? I will pull them for you.
Brayden Milner, The Milner Team at Florida Future Realty. Call or text the team.